

Introduction
Extreme weather in 2025 reshaped global travel economics. Beyond visible cancellations and closures, the financial impact extended into traveler hesitation, shorter booking windows, yield dilution, and degraded guest experiences. Hotels, cruise lines, and outdoor operators faced both direct revenue losses and indirect erosion of pricing power. The result was an estimated $10–$20 billion global revenue reduction across non-transport travel sectors.
1. The Global Revenue Impact
The total weather-related travel revenue loss in 2025 is estimated between $10 billion and $20 billion. This wide range reflects uncertainty in indirect effects such as late bookings, down-trading, and reduced ancillary spend. Roughly one-third of the total loss comes from verified, documented disruptions — physical closures, cancellations, and itinerary changes. The remaining two-thirds come from modeled estimates of yield and occupancy impacts, driven by behavioral changes in how travelers booked and priced trips. Direct impacts included resort shutdowns, festival cancellations, and cruise itinerary changes. Indirect impacts included shorter booking windows, higher demand for flexible rates, late discounting, and lower in-destination spending.
2. Booking Behavior and Yield Management
Weather volatility in 2025 materially changed how travelers planned trips. Across multiple markets, booking lead times fell between 5% and 25%. Travelers adopted a “wait-and-see” approach, compressing booking curves and forcing operators to rely on last-minute promotions. Expedia reported that in Q3 2025, global searches for trips 0–13 days out jumped 10% quarter-over-quarter, with international last-minute searches up 20%. This shift had clear consequences. Travelers delayed commitments amid weather uncertainty. Demand for refundable and flexible rates increased, raising cost pressure on operators. Late discounting diluted ADR and onboard spend. Revenue management systems struggled with volatility, reducing forecast accuracy and confidence.
In France, average booking lead time dropped to around 19 days — a 24% decline versus 2024. In the U.S., lead times fell about 11% to 26 days. In practice, this meant hotels that would typically be 70% booked two months out were sometimes only 30% booked until the final two weeks, when a rush of last-minute reservations arrived based on favorable forecasts. That unpredictability complicated staffing, pricing, and planning.
3. Why Booking Windows Shortened
Several forces drove this change. First, uncertainty and fear of disruption. Highly publicized wildfires, storms, and heatwaves made travelers more cautious. Mediterranean summer headlines led many tourists to delay bookings until conditions looked safer. Event cancellations like Bonnaroo reinforced the “book late, stay flexible” mindset.
Second, flexible cancellation options. The post-COVID preference for flexibility was amplified by weather risk. Travelers increasingly filtered for free cancellation and refundable rates, even at higher prices. OTAs reported shorter stays and lower advance bookings in climate-sensitive markets.
Third, last-minute discounting created a feedback loop. Softer early bookings led hotels and operators to cut prices closer to travel dates, conditioning travelers to wait for deals. This made early demand even weaker.
Fourth, trips themselves got shorter. Many travelers opted for closer-to-home, shorter getaways rather than long, expensive international trips vulnerable to weather disruption. A UK industry analysis noted that “later, shorter holidays” were hurting tour operator revenues.
4. Forecasting and Inventory Challenges
Traditional forecasting models (which rely on historical booking curves) struggled in 2025. With lead times shrinking and becoming erratic, comparing to prior years often misled revenue teams. Hotels that expected 80% occupancy sometimes ended up at 60% when a forecasted booking surge failed to materialize due to storm warnings. In other cases, last-minute surges overwhelmed lean staffing. Weather uncertainty also forced more dynamic inventory management. After Cyclone Ditwah in Sri Lanka, hotels held rooms back for relief efforts and late bookings rather than filling everything in advance. In Jamaica, tour operators had to rebuild schedules on the fly after Hurricane Melissa. Ski resorts in North Carolina struggled to staff up because prior storm damage had scared away seasonal workers, limiting how much business they could take even when conditions improved.
5. Pricing Power and Yield Dilution
With travelers holding back or demanding flexibility, revenue managers lost confidence in holding high rates far in advance. In wildfire-prone regions, peak booking periods stalled, forcing hotels to either drop rates or risk unsold rooms. In Jamaica, after Hurricane Melissa, around 30% of hotel rooms were offline, yet open properties still had to rely on promotions to restore demand rather than raising prices.
Similarly, Southern European tour operators discounted packages when extreme heat dominated headlines. The net effect was yield dilution — missing early high-ADR bookings and relying more heavily on discounted late sales.
6. Tech and Real-Time Pricing
On the positive side, the industry accelerated adoption of smarter tools. AI-driven revenue management systems increasingly integrated real-time weather data to adjust pricing and demand forecasts. Airlines began incorporating climate analytics into capacity planning. Hotels started using forward-looking signals — such as search spikes for cooler destinations during heatwaves — to tweak rates in real time.
Parametric insurance also gained traction. Some destination marketing organizations in ASEAN explored policies that would pay out if a typhoon above a certain intensity hit, giving operators funds to offer refunds or credits without bearing the full financial burden.
7. Case Studies: When Weather Hit Hard
Several high-profile events illustrated how vulnerable tourism was in 2025.
In May, flash floods swept through Petra in Jordan, forcing the evacuation of nearly 1,800 tourists and temporarily closing the site, causing days of lost revenue.
In Nevada’s Black Rock Desert, severe dust storms and high winds disrupted Burning Man, shutting down gates, closing the airport, and damaging installations.
Near Las Vegas, the RISE Lantern Festival had to cancel its signature lantern release due to 40 mph gusts.
In Morocco, a rare once-in-20-years deluge in Safi caused flooding, cancellations, and transport disruptions.
In the UAE, a historic winter rainstorm flooded Dubai, disrupted flights, and forced beach and attraction closures during peak travel weeks.
These events underscored that even destinations marketed as “guaranteed dry” were vulnerable to sudden extremes.
8. Regional Revenue Loss Estimates
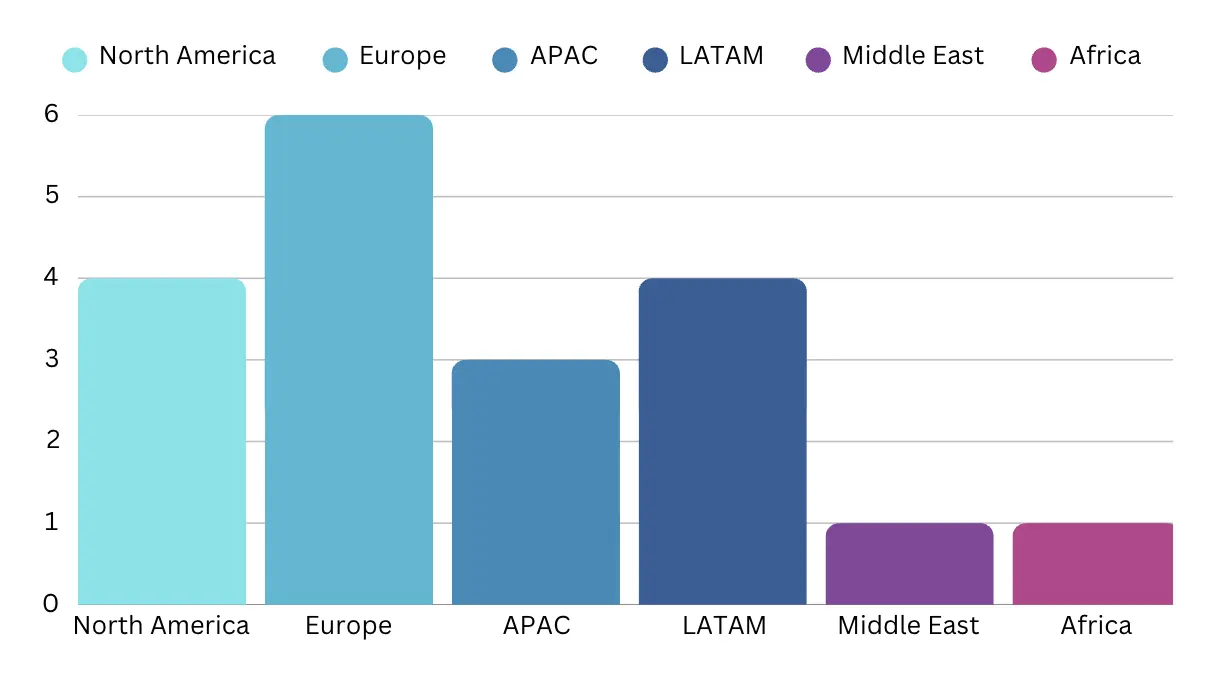
North America saw an estimated $2–3 billion in travel revenue losses. Wildfires, severe storms, and winter weather disrupted outdoor tourism, although the U.S. benefited from a hurricane season with no landfalls.
Europe experienced the most severe impact, with estimated losses of $5–7 billion, driven by heatwaves, wildfires, and evacuations in places like Rhodes.
Asia-Pacific saw around $3 billion in losses from cyclones, monsoons, and early bushfires in Australia.
Latin America and the Caribbean lost roughly $2 billion, largely due to Hurricane Melissa in Jamaica and lingering impacts from Hurricane Otis in Acapulco.
The Middle East saw around $1 billion in losses, mostly from heat, flooding, and sandstorms.
Africa experienced less than $1 billion in losses overall, though drought in East Africa hurt high-end safari tourism.
9. The Most Affected Destinations
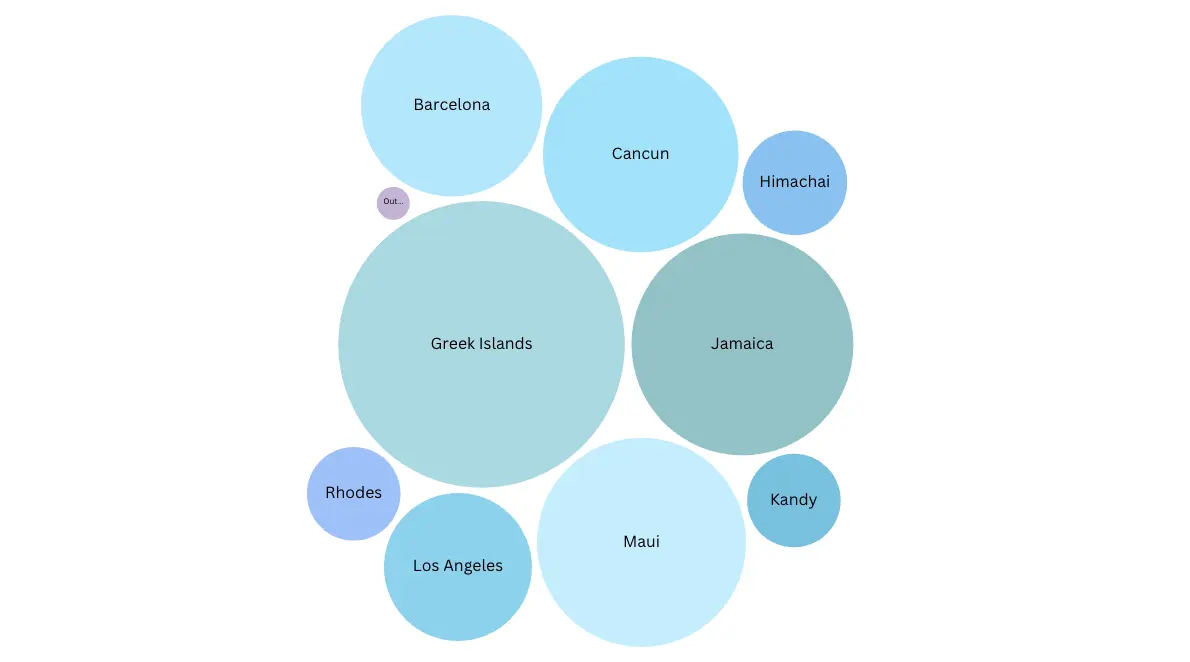
Jamaica, particularly Montego Bay and Negril, saw $350–$450 million in verified tourism losses from Hurricane Melissa.
The Greek Islands, especially Rhodes, Corfu, and Mykonos, likely lost $500 million to $1 billion due to heatwaves and wildfires.
Maui faced $200–$400 million in estimated losses tied to wildfire recovery and heat stress.
Barcelona saw $150–$300 million in estimated losses from heatwaves affecting urban tourism and events.
Cancún and the Riviera Maya lost $200–$350 million, driven by storms and sargassum blooms.
Los Angeles likely lost $100–$200 million from flooding and heat affecting outdoor events.
10. The Structural Problem: Forecasting Isn’t Enough
2025 revealed a consistent economic vulnerability. The issue wasn’t a lack of weather awareness, forecasts were often accurate. The problem was that the industry had no systematic way to manage the financial consequences of bad weather. Travelers reacted cautiously, delaying bookings or demanding flexibility. Operators responded defensively with late discounts or absorbed cancellation costs. Revenue became volatile even when demand still existed.
Desert festivals were disrupted despite advanced warnings. Heritage sites in typically dry regions closed due to flash floods. Winter sun destinations lost revenue during rare rainy peak weeks. In every case, the damage came not from “unexpected weather,” but from unpriced and unprotected weather risk.
11. Weather Guarantees: A Market Mechanism
This is where weather guarantees come in. They are not a replacement for forecasting, insurance, or flexible cancellation policies. Instead, they fill a missing gap. Forecasts predict probability, but not financial outcomes. Cancellation policies shift friction, but don’t prevent revenue loss. Weather guarantees transfer the financial consequences of adverse weather, stabilizing booking behavior, reducing last-minute discounting, and restoring pricing confidence earlier in the booking cycle. In regions where bad weather is unusual rather than seasonal, guarantees help normalize traveler confidence without forcing operators into heavy discounting.
12. Why This Matters Now
The biggest revenue losses in 2025 did not come from physical closures alone. They came from behavioral hesitation, shorter lead times, weaker pricing power, and higher flexibility demands. As climate variability expands into traditionally “safe” destinations, assuming weather risk is manageable or negligible is no longer viable. Guarantee-based approaches acknowledge reality by pricing, modeling, and transferring weather risk instead of ignoring it.
13. Methodology in Plain Terms
What we know for sure: documented cancellations, closures, and publicly disclosed revenue shortfalls.
What we estimated: indirect effects such as yield dilution, down-trading, and reduced ancillary spending, modeled using OTA and revenue management trends.
We used low, mid, and high scenarios based on verified baselines, with a margin of error of about ±25% for indirect estimates, all standardized to USD.
Conclusion
Weather volatility in 2025 exposed structural weaknesses in how global travel manages risk. Direct losses from hurricanes, wildfires, and cancellations were visible. But the bigger financial drag came from traveler hesitation and pricing instability. For CFOs and revenue leaders, the lesson is clear: climate resilience is no longer just about infrastructure. It must include forecasting, pricing, behavioral analytics, and new financial tools like weather guarantees, across every segment of the travel economy.
*Sources: reuters, theguardian, apnews, euronews, fox5vegas, thenationalnews


%201.avif)